Scraping data for LaMetric Time
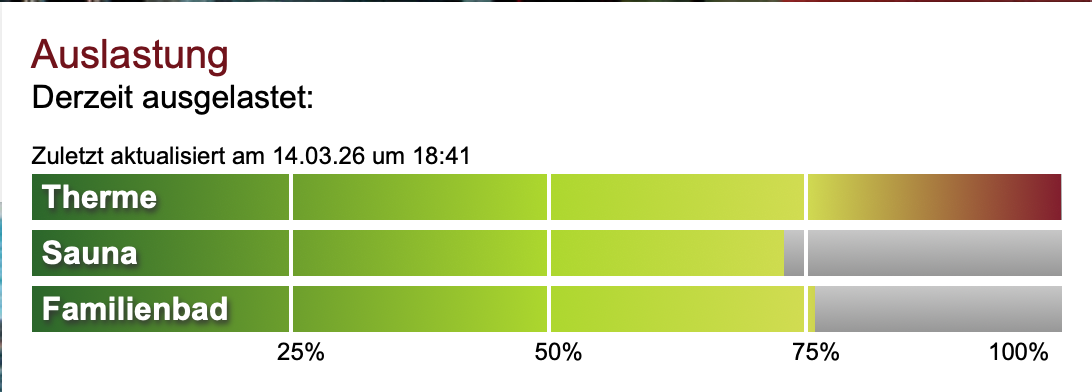
We go to Rupertus Therme pretty regularly. It’s a spa and sauna place in Bad Reichenhall, just across the Austrian border. The one annoying thing is showing up and it being packed. Their website has an occupancy widget but remembering to check it before leaving the house is its own problem.
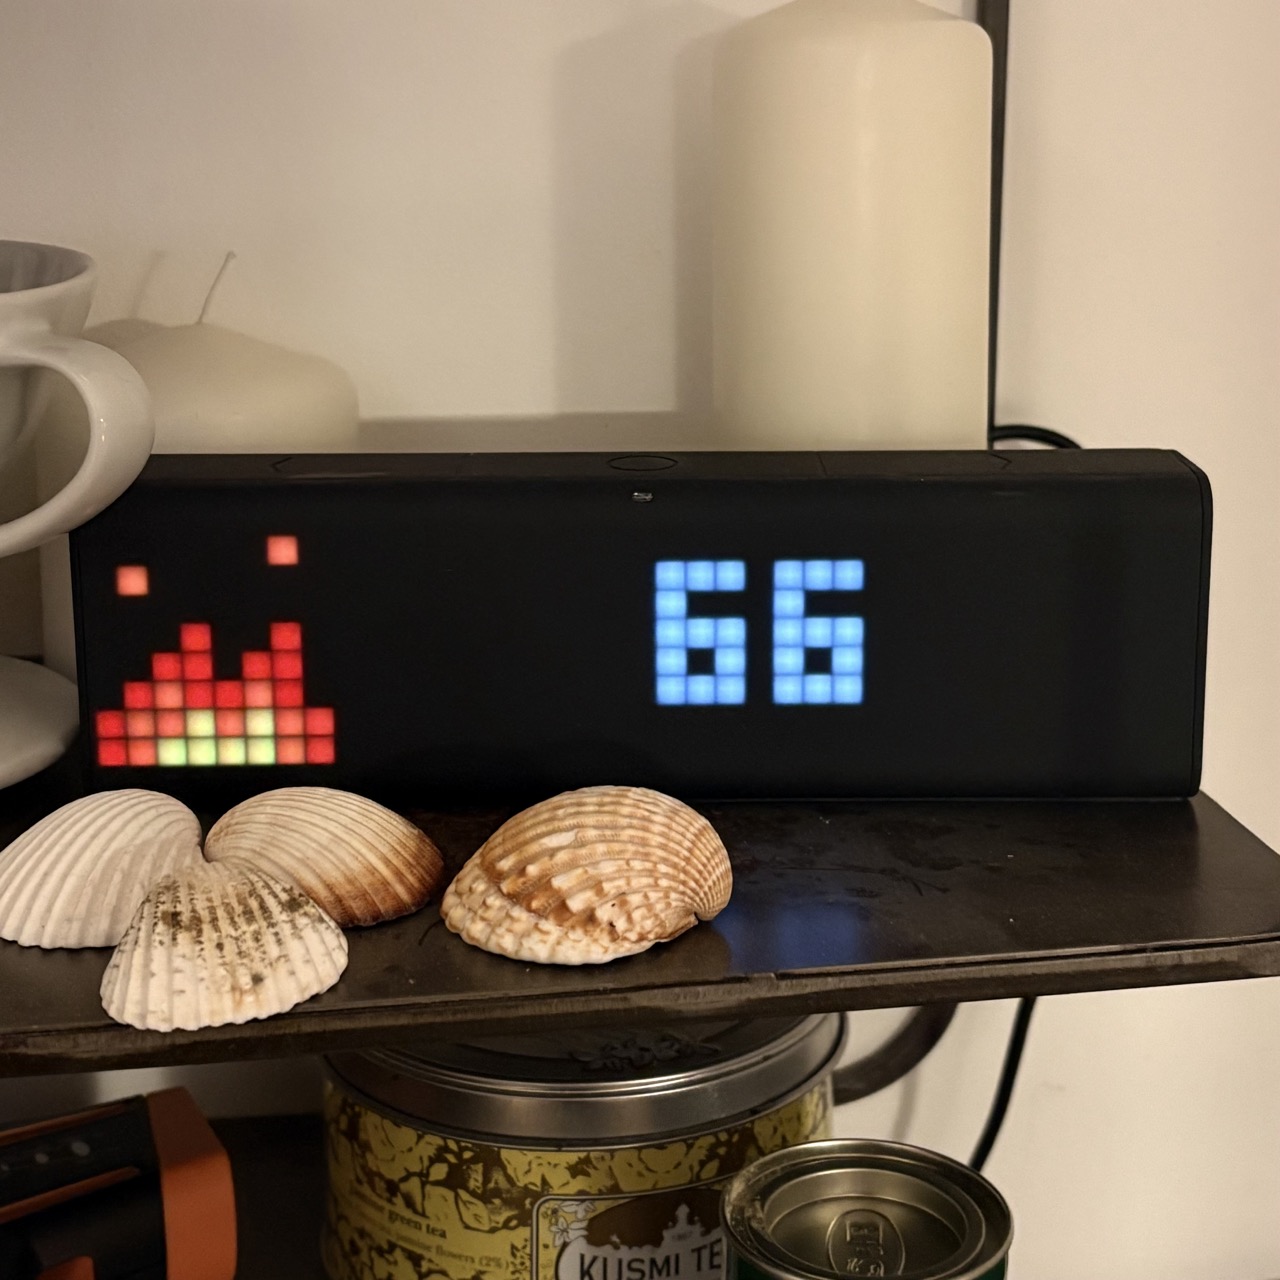
Last Christmas my company gifted me a LaMetric Time, a small desk clock made of LED pixels for showing live data. I played around with the built-in app store and thought: this should show the Rupertus occupancy. That kicked off a weekend project.
Here’s the result sitting on our shelf:
NoCode first
The obvious move for an engineer would be to scrape the site, stick the data somewhere, build a small API. I wanted to see how far I can get without any of that.
Google Sheets has IMPORTXML, which fetches a URL and pulls out nodes with an XPath expression. The occupancy widget is plain HTML, so this felt worth trying. Poking around in DevTools, the relevant structure looks like this:
<div class="Load__Bars">
  <div class="Load__BarCurrentLoad" data-occupied="23"></div>
  <div class="Load__BarCurrentLoad" data-occupied="55"></div>
  <div class="Load__BarCurrentLoad" data-occupied="30"></div>
</div>
Each Load__BarCurrentLoad has a data-occupied attribute containing a percentage. First attempt:
=IMPORTXML("https://www.rupertustherme.de", "//div[@class='Load__BarCurrentLoad']/@data-occupied")
Six rows instead of three. The page has both mobile and desktop versions of the widget in the HTML. Fixed by grabbing just the first Load__Bars parent:
=IMPORTXML("https://www.rupertustherme.de", "(//div[@class='Load__Bars'])[1]//div[@class='Load__BarCurrentLoad']/@data-occupied")
Three rows, three values for Therme, Sauna and Familienbad. Turns out data-occupied is the free percentage, so the final formula wraps everything in ARRAYFORMULA and flips it:
=ARRAYFORMULA(100 - IMPORTXML("https://www.rupertustherme.de?nocache="&C1, "(//div[@class='Load__Bars'])[1]//div[@class='Load__BarCurrentLoad']/@data-occupied"))
How often does this update?
IMPORTXML doesn’t refresh reliably on its own. Google controls when it re-fetches and it can go stale for hours.
The ?nocache= bit in the formula is the fix. Cell C1 holds a timestamp updated by this Apps Script function, set to run on a trigger every few minutes. Since the URL changes each time, Sheets has to re-fetch it.
function updateTimestamp() {
  var sheet = SpreadsheetApp.getActiveSpreadsheet().getSheetByName("Sheet1");
  sheet.getRange("C1").setValue(new Date().getTime());
}
The spreadsheet is publicly viewable here: Rupertus occupancy sheet.
Getting it onto the LaMetric
LaMetric has a “My Public Data / Google Sheets” app that displays a single cell value. I pointed it at the sauna occupancy cell and it works. But showing a single number feels like a missed opportunity when the original widget has three bars.
What’s next
Probably nothing! I appreciate how refreshingly fast it was to build this with almost zero actual coding. We look at this now everyday and it makes both me and my partner smile often.
Two natural steps to build this out more would be to store the data historically to figure out patterns. And build a custom visualisation with three proper LED bars, though that likely requires a native LaMetric app.